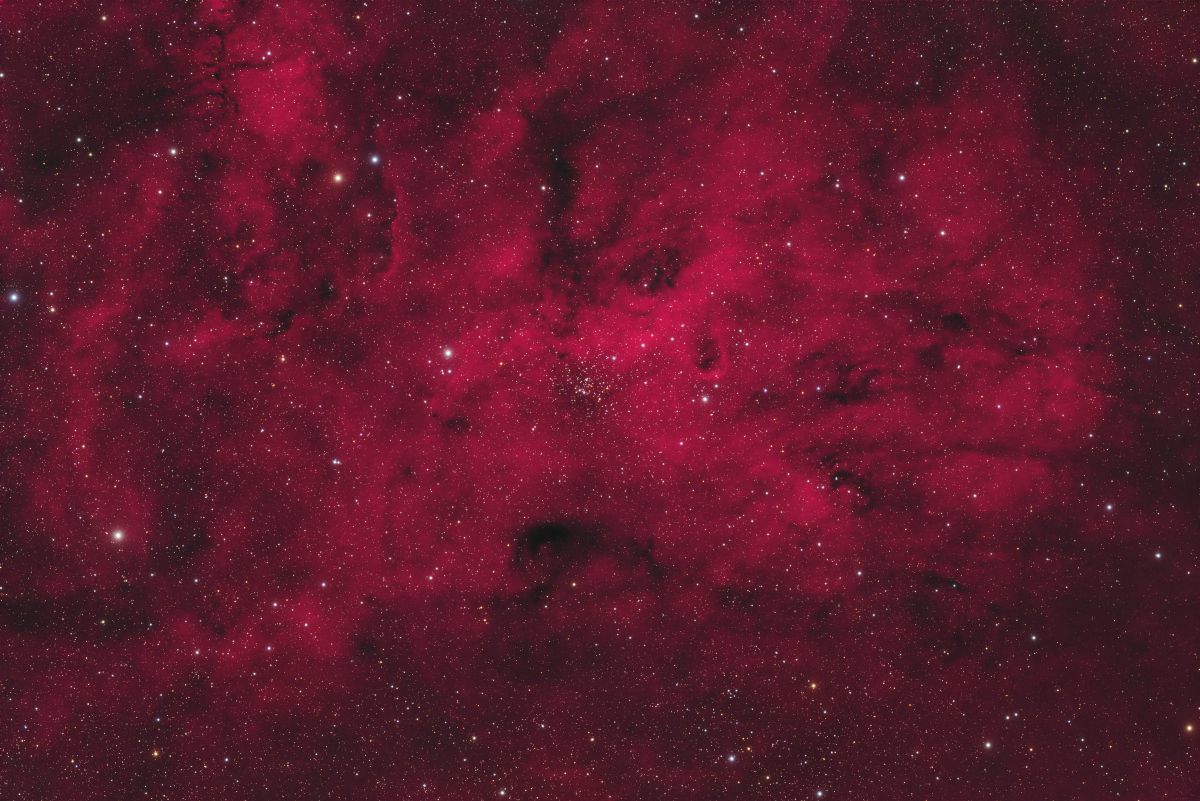
Star Cluster NGC 559 and Super Nova Remnant (SNR) G127.1+0.5
Published 21 Dec 23
This data was taken with a 152mm f8 refractor and ASI 6200 camera from 8 Sep 23 - 8 Nov 23. It includes 27hrs of Ha, 20 hrs of OIII, and 2hrs each of RGB.
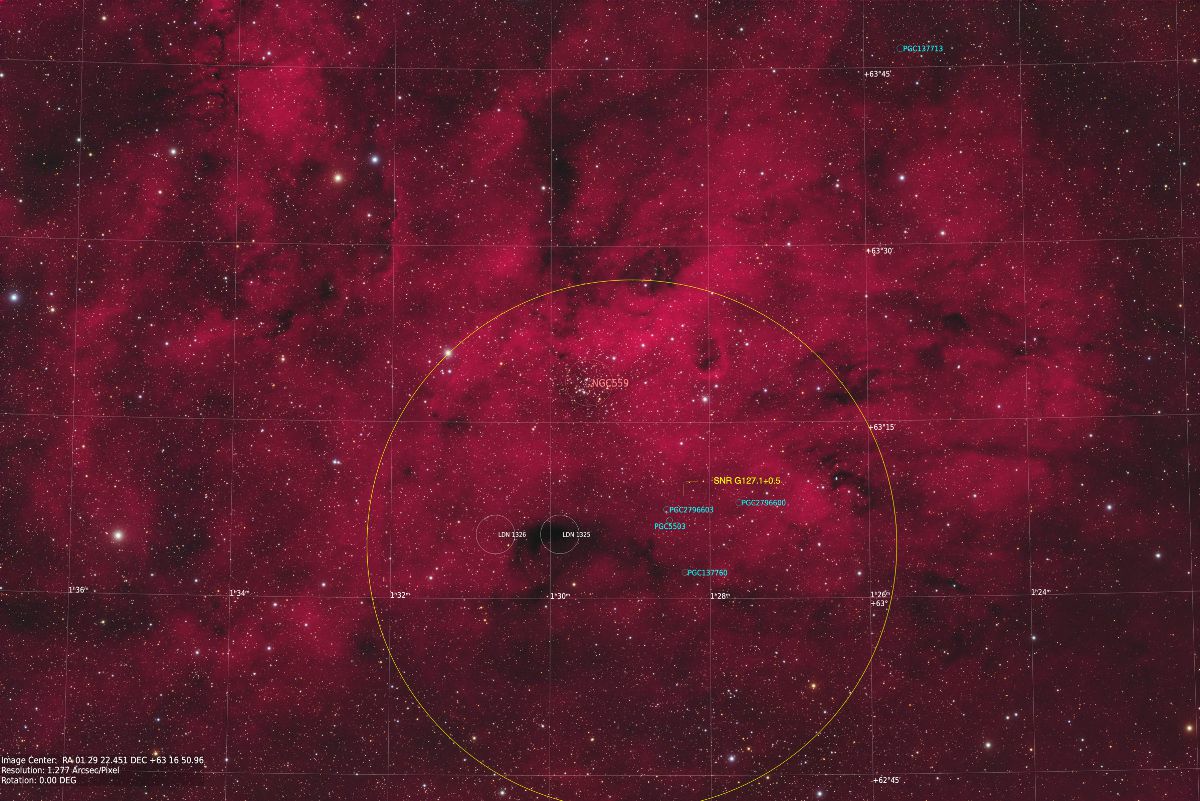
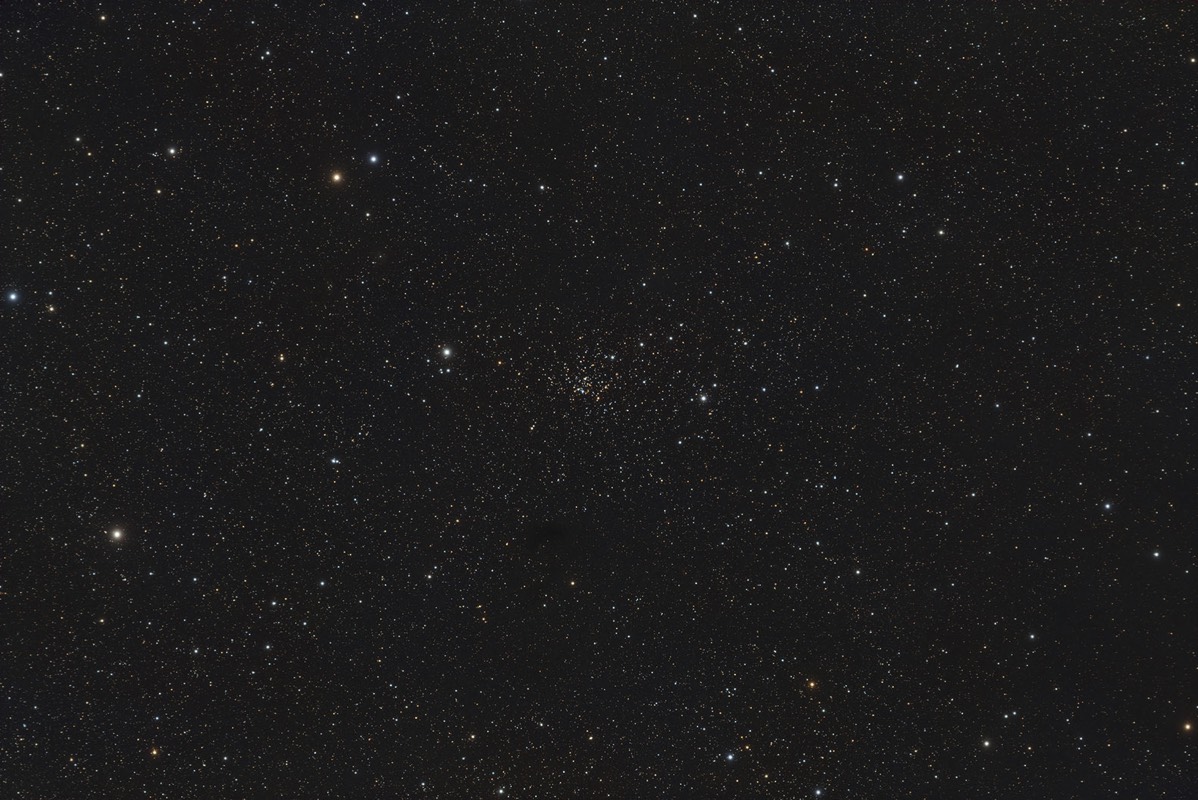
The image below is a RGB image of NGC 559 in Cassiopeia. This wide view taken with a 152mm refractor and ASI 6200 CMOS camera shows the star cluster near image center. NGC 559 is approximately mag 9.6 and near 9 arcmin in diameter. The estimated distance (2006) is approximately .9-1.3 kpc or 2900-4240 light years. NGC 559 contains stars on the order of 11-12th mag and many fainter. The 2nd image below also shows a huge amount of emission nebulosity within this area. Within this nebulosity is the Super Nova Remnant (SNR) G127.1+0.5. I believe this is the first amateur optical image of this Super Nova remnant. While NGC 559 is beautiful in itself you would not even know SNR G127.1+0.5 was visible here. The following images and professional data is the evidence I provide.
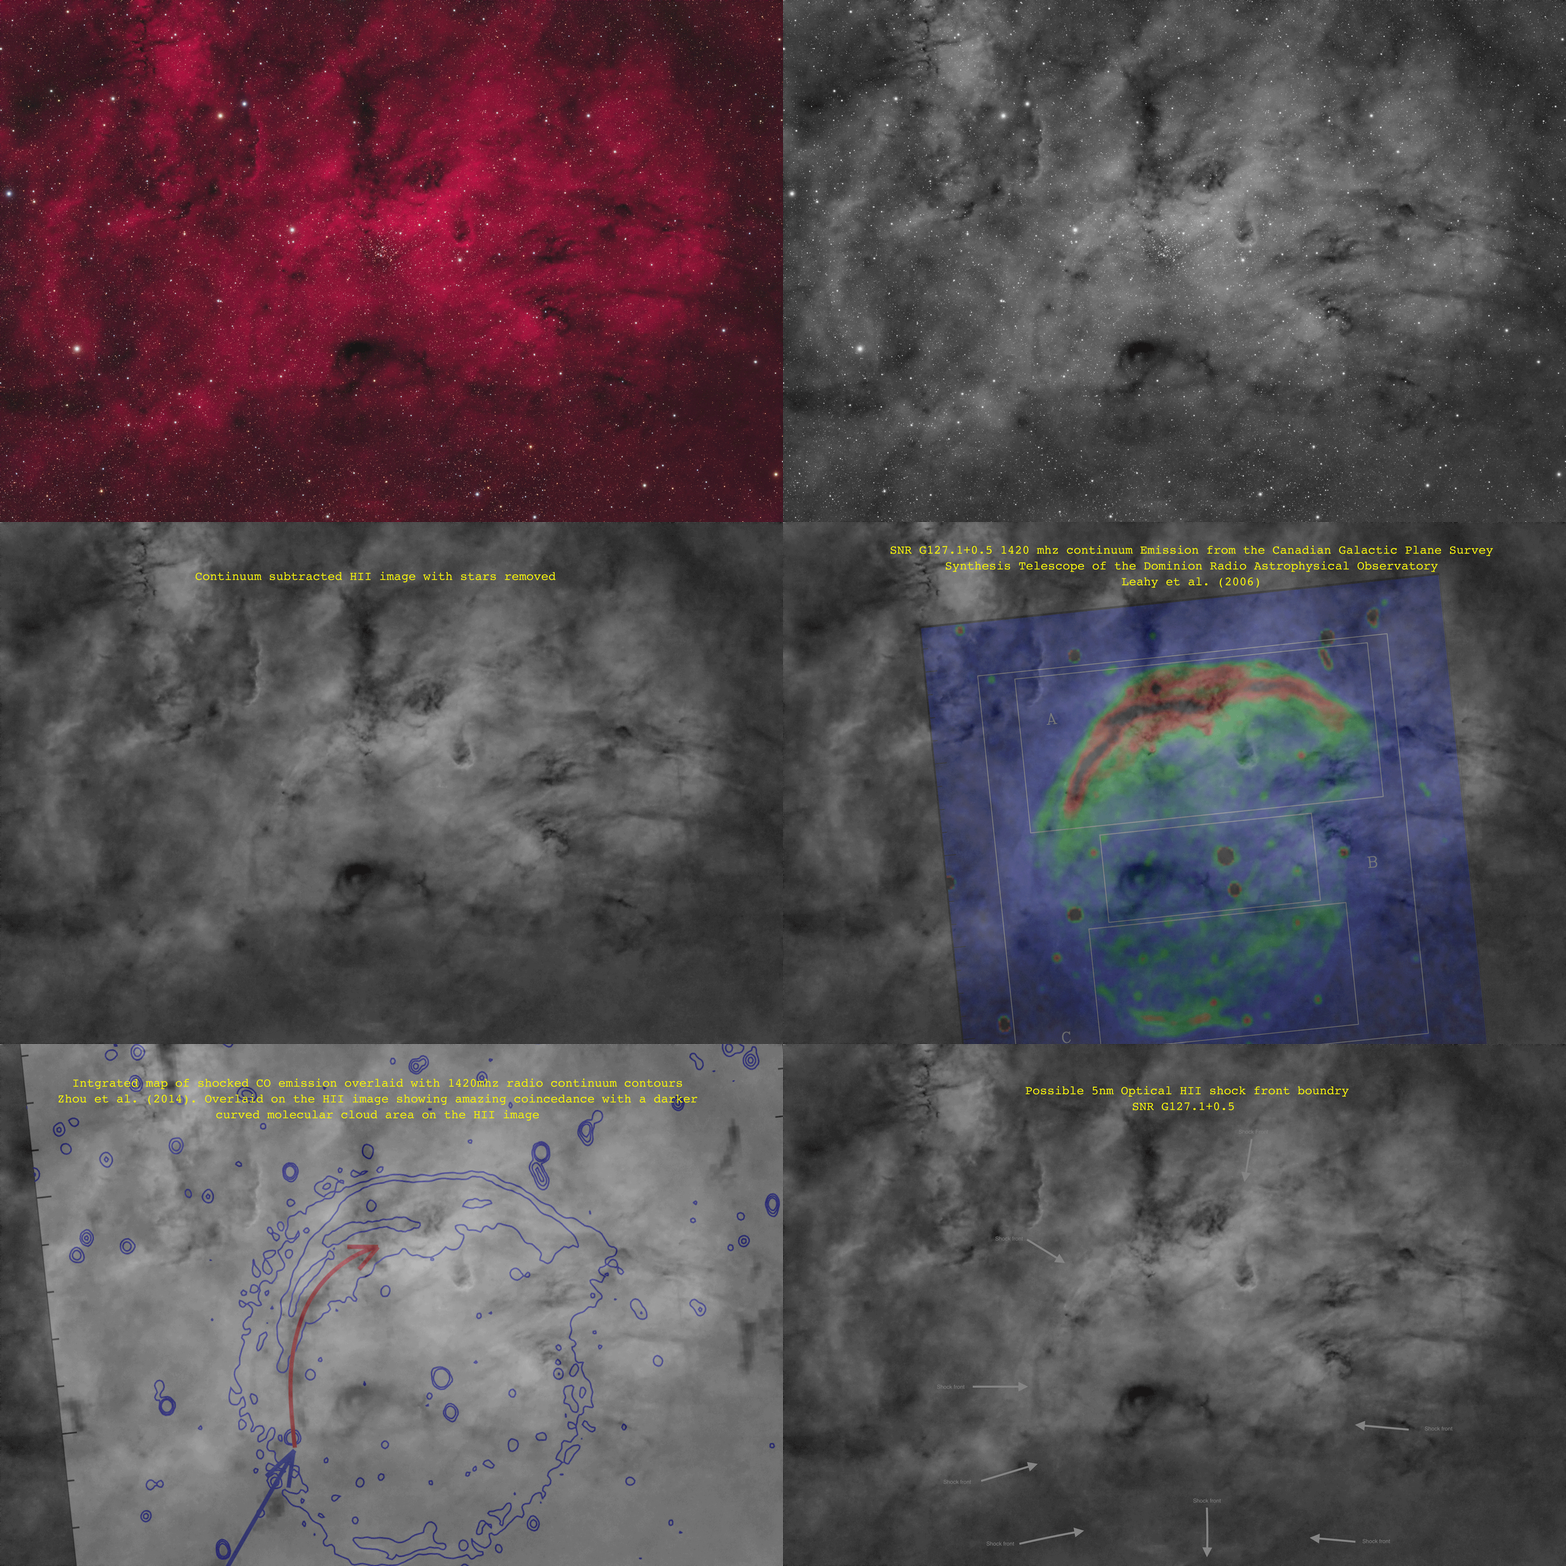
Hydrogen emits light in the wavelength of red. Above you can see the immense area of hydrogen emission that is around NGC 559 intermixed with darker areas of dust.
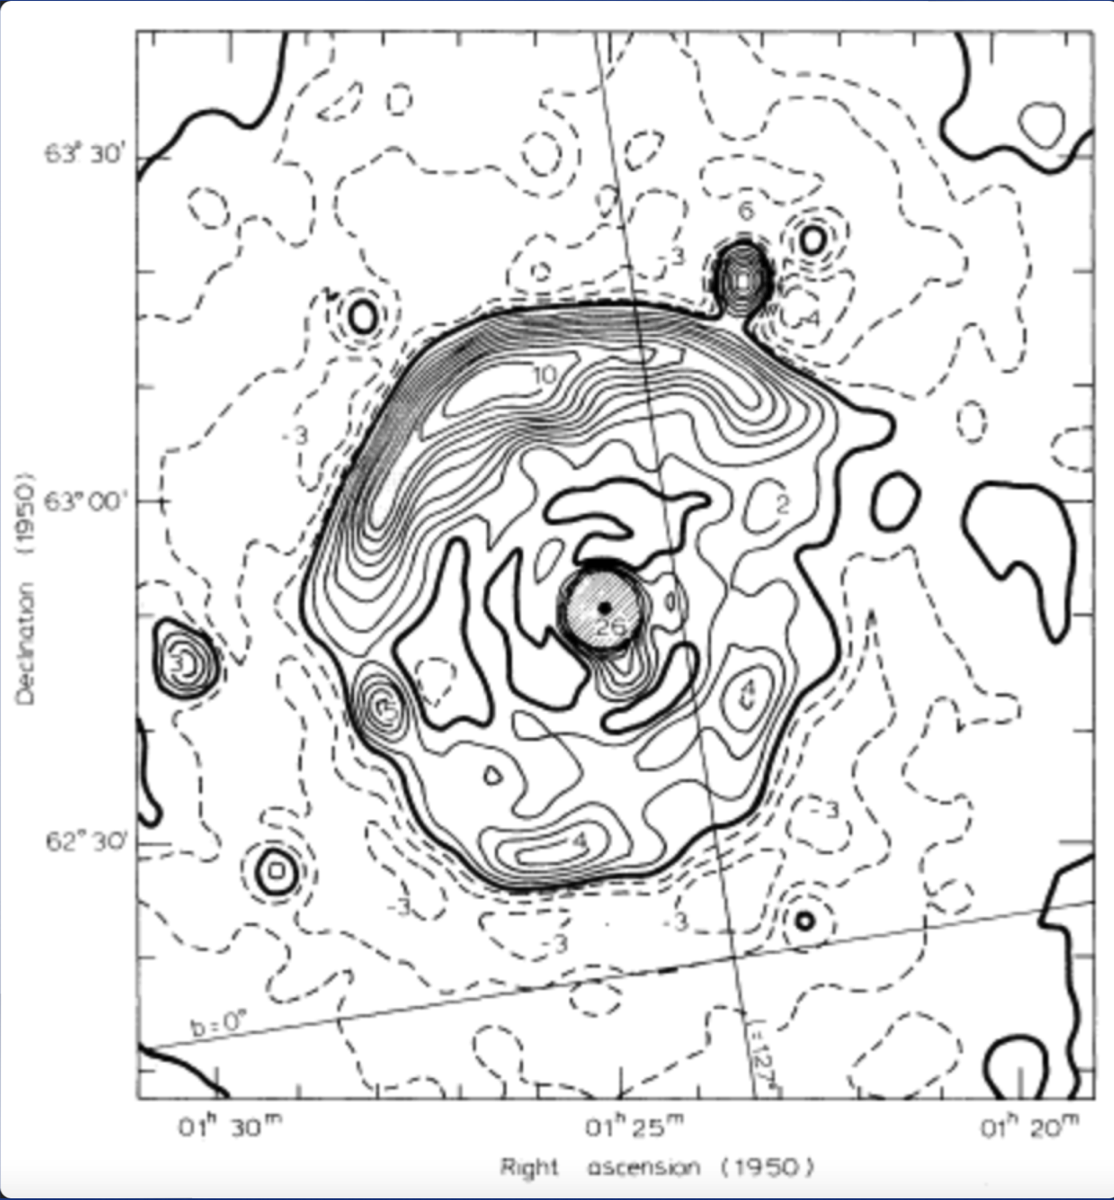
Above is the 1420 mhz radio continuum data from the 1/2 mile Cambridge telescope (Carswell paper)
This central point source, called G127.11+0.54, would later be identified as an Active Galactic Nucleus (AGN). Carswell concluded that this object was probably a SNR.
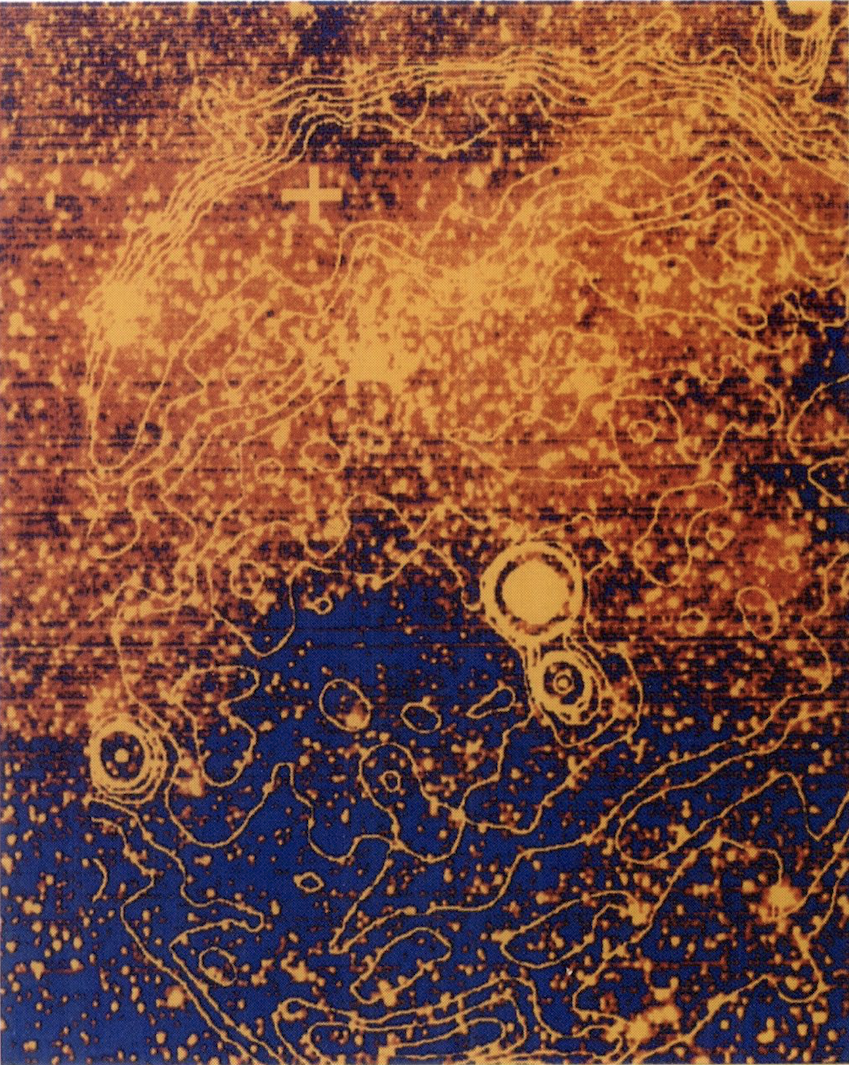
Optical Ha data from the Xilouris et al. (1992) paper overlaid with radio continuum data
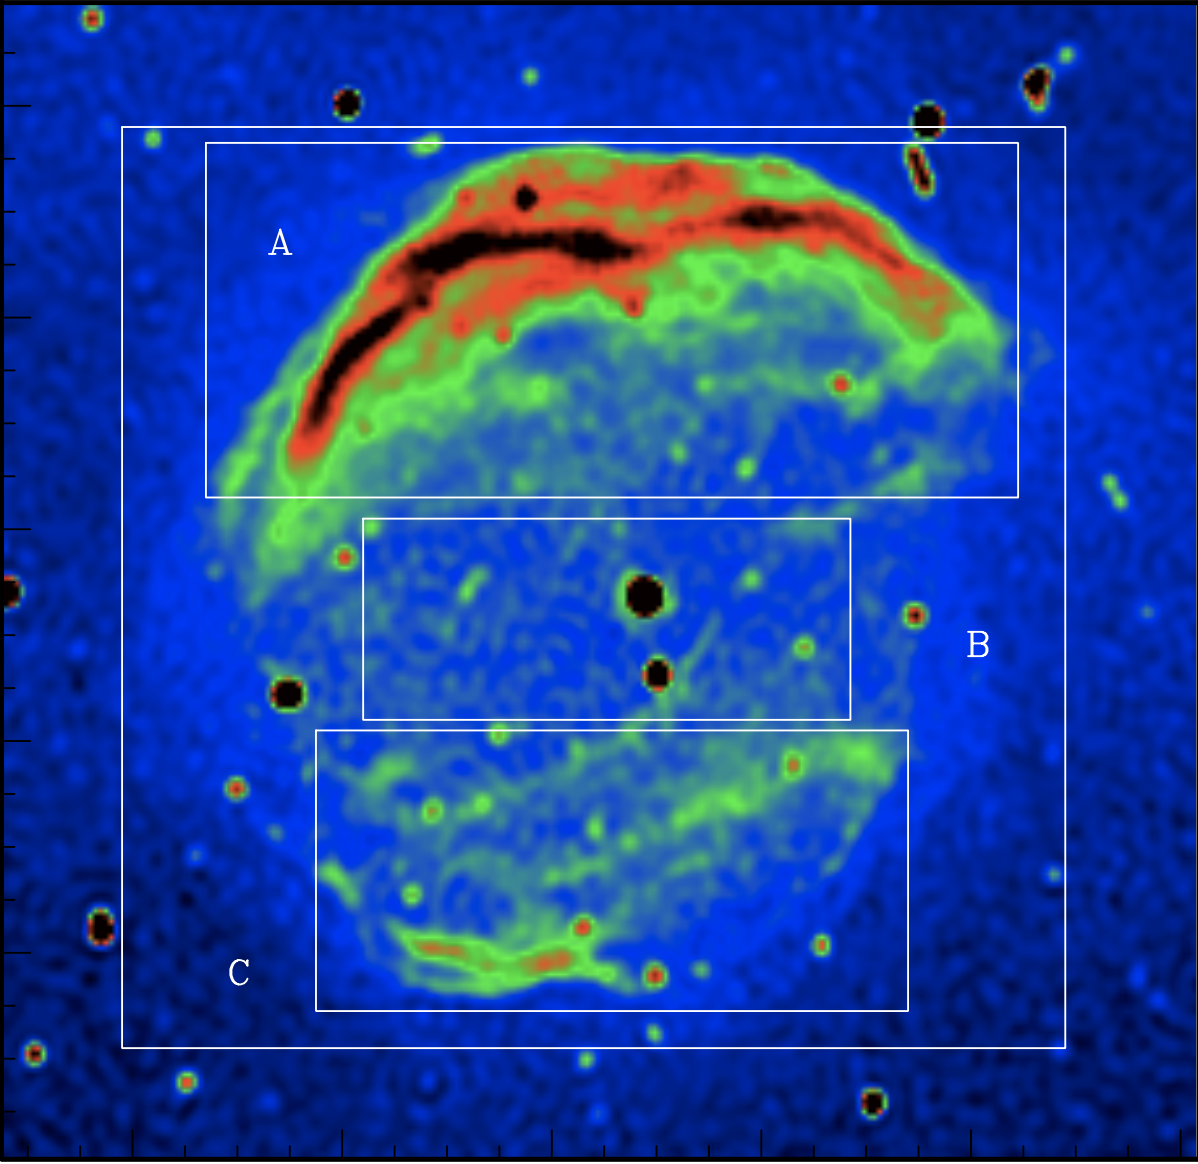
SNR G127.1+0.5 1420 mhz continuum Emission from the Canadian Galactic Plane Survey Synthesis Telescope of the Dominion Radio Astrophysical Observatory Leahy et al. (2006)
This new radio data showed the outline of the SNR in great detail. The stronger signal is in the northern half. The southern half also has some decent signal. The outline of the brighter blue area is where the signal drops off and its a nice round circle 45 arc min wide.
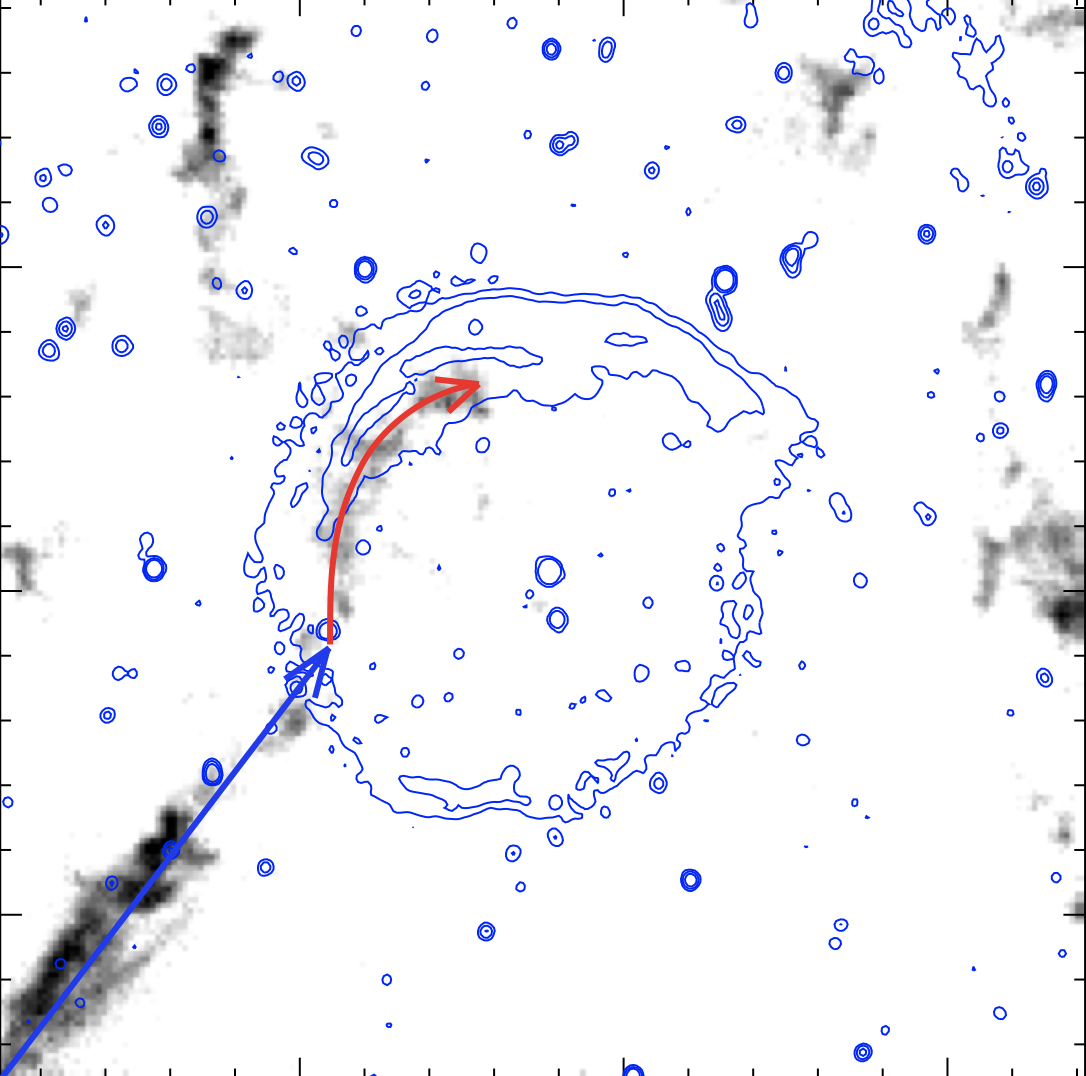
CO integrated image showing a curved portion of a molecular cloud (in Red) which was bent by the shock of the SN explosion. Zhou et al. (2014)
So what does all this have to do with the image I took of NGC 599? Well if you overlay these images from these different papers you can see that the radio data, which outlines the SNR clearly matches a faint nearly circular boundary in my HII image which I think is the reflection of the shock boundary in Ha. The curved molecular cloud from the Zhou paper also closely matches a curved darker cloud in the Ha image. So below is an animation of my data overlaid with the image data from these papers.
I sent this data and animation to Dr. Knox Long, a emeritus astronomer at the Space Telescope Science Institute and Dr Robert Fesen at Dartmouth College. Both specialize in supernovae and their remnants.
Here is a quote from Dr Long, "I also think it is likely that you have detected the shock in Ha (on the side where the SNR looks to be running into a molecular cloud according to https://ui.adsabs.harvard.edu/abs/2014ApJ...791..109Z/abstract. Your images certainly look a lot more convincing than the images that Xilouris obtained in the 90’s."
Dr. Fesen, from Dartmouth, also mentioned that this is the probable answer, "Your Halpha image(s) appear likely to have detected emission from the G127 SNR. Yay. But they appear pretty faint so getting confirming spectra will take a bit of doing. But their match to the edges of the WENSS radio map is strongly suggestive.
Your images are far better and more useful that those taken by Xilouris et al. (1993) so I think you should post them on Astrobin. The G127 SNR has not gotten much attention
from optical SNR researchers so far but maybe that will change with your new images."
Lastly I would like to show the 20hr starless and continuum subtracted OIII image of this area. The OIII image does not show any faint wispy features like the SNR G126.1+1.2 just to the north of this area. It does show very faint OIII emission around this entire area
Above is the 20hr OIII image which has been continuum subtracted and the stars removed
So, I think its pretty suggestive that, indeed, we can see this shock front in Ha data. The imaging equipment we have now is so much better than what professional astronomers had to use in the 90's when this was discovered. I hope this set of images and data will convince some professional researchers to take new spectra on this object and solve this question.
My many thanks go out to Sakib Rasool for suggesting this region of the sky and to Dr's Long and Fesen for giving me a bit of guidance as to what I was probably seeing in my Ha image.
- Optics : Stellarvue SVX 152T refractor @f8 1200mm FL
- Mount: Paramount MYT
- Camera: ZWO ASI6200
- Filters: Chroma 50mm RGB, 5nm OIII and Astrodon 5nm Ha
- Exposure (min): RGBHaOIII 120:120:120: 1620:1200 53hrs, 2x2 binning
- Automation Control: The Sky X, Voyager, PrimaluceLab Eagle 4
- Guiding: StarlightXpress Lodestar X2
- Processing Software: PixInsight, PS CC
- Location: Stark Bayou Observatory, Ocean Springs, MS
- Sky: Typical SQM 19.6-20.1, Bortle 5, Suburban
- Date: 8 Sep - 8 Nov 2023
